

The US Debt Ceiling


There has recently been widespread news about the United States debt ceiling issue. The US government has once again reached its legal borrowing capacity (debt ceiling), currently valued at $31.4 trillion.
Treasury Secretary and former Chair of the Federal Reserve Janet Yellen warned that failure to raise the debt ceiling by as early as 1st June (just a few days away) would result in the government not being able to pay their liabilities on time. Those payments include interest payment to current US Bond holders, Social Security, Medicare, tax refunds, military salaries, and other government expenditures.
On a macroeconomic scale, failure to pay interest payments on time to US Bond holders will very likely lead to a downgraded appraisal for US debt, which currently has an almost pristine rating score (perfect triple A rating from Moody’s and Fitch, whilst an AA-plus rating by S&P Global - their second highest rating).
If this downgrade happens (and that’s a big ‘if’), it may potentially create a vicious cycle towards the bottom where lower ratings causes harder debt issuance, which causes less funds to pay liabilities, which causes more defaults on payments, which causes even lower ratings…

I’ve never been particularly interested (or well informed) in US politics; but as someone with a financial and accounting background, I wanted to learn more on what the deal is with this whole debt ceiling fiasco. News articles sometimes have a tendency to hyperbolize, mis frame, or even skew certain statistics in order to distort reality and make something more attention grabbing than it actually is.
In order to avoid these pitfalls, I decided to look at the hard numbers myself in order to get a more objective depiction of the situation:
What stories are the comprehensive financial statements actually telling?
So I went to the United States Treasury website and pulled out their financial statements, just as I would do for an institution operating within the private sector. It turns out that yes, just like any other company, the US government does have a balance sheet, an income statement, and cashflow statements that are published regularly on their website.
It didn’t take long at all (probably 5 minutes, in fact) until I found worrying numbers that any graduate accounting student would immediately recognize.
In this article, we’ll just talk about the balance sheet.
*You can retrieve all the data from this link if you are interested:
Balance Sheet
Before even looking at the balance sheet, I knew (from many news sources) that the debt ceiling level was currently at $31 trillion. So on the right side of the balance sheet I would expect to see at least $31 trillion in liabilities.
I also expected some value of equity (whatever that may be, let’s say $5 trillion just to pick a random number) on the right side of the balance sheet, and thus, on the left side there would be $36 trillion in total assets controlled by the US government. Keep in mind that all these thoughts were just random thoughts that went through my mind before I even opened up the balance sheet. I was just thinking out loud, just having random preliminary conceptions on what the balance sheet might look like.
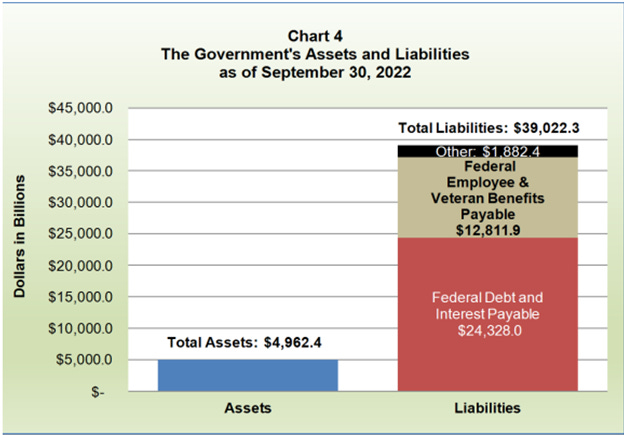
Below are the actual balance sheet figures.
(Note that the US Treasury’s fiscal year is different than the calendar year, as it starts in October 1 and ends in September 30 the next year.)

The first thing that blew my mind was the fact that the left side of the balance sheet (assets) only accumulated to $5 trillion (I never thought I would use the word ‘only’ preceding ‘$5 trillion’). Given that I was aware that the debt ceiling was currently at $31 trillion, asset levels at that amount seemed unsustainably low (i.e. how could those assets possibly service that level of debt?). Something fishy was going on here.
The second thing you may notice is that total liabilities are in fact $39 trillion, which is more than $31 trillion. That means that the US government has even more liabilities outside of the $31 trillion that it has currently maxed out in the debt ceiling. Out of the $39 trillion of total debt, about $24 trillion are federal debt and interest payable (money that the US government has borrowed by issuing bonds to individuals, corporations, and other countries), and about $13 trillion are federal employee and veteran benefits payable (salaries and other compensation for public civil servants and military veterans). I suspect that the majority of the $31 trillion debt ceiling compose of these two items as well.
Back to Accounting 101
Assets = Liabilities + Equity (Net Position)
Now if assets are only $5 trillion whilst liabilities are $39 trillion, then by the stubborn laws off accounting: your equity should be negative. You see, balance sheets have this somewhat annoying property of having to actually balance → hence the ingenious name.
The numbers speak for themselves: the US government is operating at a negative equity level of $34 trillion, an astounding balance that has never been published in any news articles I’ve read so far.
You see initially, I thought that the news was trying to somewhat mislead the public by only reporting one number (the $31 trillion debt ceiling level) instead of illustrating a more comprehensive financial picture. It is almost impossible to objectively assess a financial situation simply by looking at a single number, you need much more context than that.
The number $31 trillion may seem like a tremendous amount of debt, but if you have assets of $40 trillion (which I naively thought that the US government may have, given their economic position globally), then it’s a totally different story. Whatever level of debt that a person or institution takes on is always justifiable as long as they possess the assets (ideally liquid assets) to cover that debt.
I ended up being the fool here, because the reality was even worse than I had initially preconceived. I could never had guessed that the US government would possess such a low amount of assets as compared to their liabilities, creating an astoundingly large negative equity balance.
The US government is like a rich friend who proudly shows off their new Lamborghini whilst secretly scrambling to borrow money to pay off the damn thing. The difference is, their toys are bigger. Instead of Lamborghinis, they are proud of their multi-billion-dollar stealth fighter jets and nuclear submarines.
Let’s just look at one item on the liabilities side → the $13 trillion of ‘Federal employee and veteran benefits’ liability. These are payment obligations to many millions of public civil servants and military veterans, which are possibly the most ethically crucial payments to adhere to. Notice that even if the US government manages to sell all their assets at their current marketable value of $5 trillion, they would still be $8 trillion short.
To my American friends reading this, I suggest that you look at the bright side:
The next time you’re feeling particularly patriotic and happen to have an extra $8 trillion laying around the house, at least you know who to give it to.
You’re good old Uncle Sam.
On the next few articles, we will look at the balance sheet of the UK for some comparison, the US Treasury’s Income Statement, and how in the world did the United States manage to create such a deep $34 trillion financial hole for itself.
Fun times.